 | 15 Aug 2019
Sea cliff at Kieler Ufer (Pleistocene stripes 11–16) – large-scale architecture and kinematics of the Jasmund Glacitectonic Complex
Anna Gehrmann
Martin Meschede
Heiko Hüneke
Stig A. Schack Pedersen
The Kieler Ufer cliff section is a structural key location in the late Weichselian thrust-dominated-to-fold–thrust-dominated glacitectonic complex of Jasmund. Restoration and balancing of geological cross sections from the eastern coast (southern sub-complex) enabled strain quantification and the illustration of stress orientation. The entire horizontal shortening of the Kieler Ufer section is 1280 m (51.6 %) at its minimum. The thrust faults generally inclined towards south indicate a local glacier push from the S/SSW, which fits well into the glacio-dynamic model suggested by Gehrmann and Harding (2018).


The sea cliff Kieler Ufer (KU) is located on the east coast of Jasmund, and it is easily accessible via the stairs at the creek Kieler Bach (54∘33.165′ N, 13∘40.594′ E), which crosses the fault boundary between the imbricates S13 and S14 (Fig. 1a). The abbreviation S used in conjunction with a number stands for “section”, and the section numbers S11 to S16 in the Kieler Ufer cliff profile have been adapted from the Pleistocene-stripe annotations given by Jaekel (1917). The horizontal length of the entire cross section is 1202 m. The highest point of the cliff profile is at the southernmost top of S15 (64 m a.s.l.).
The Kieler Ufer section represents a key area in the contractional fold-and-thrust system of Jasmund's southern structural sub-complex, which is a large imbricate fan with a number of individual thrust sheets and at least three duplex stacks (S01 to S23) (Gehrmann, 2018; Gehrmann and Harding, 2019). The large-scale glacitectonic folds and associated thrusts deforming both Upper Cretaceous (Maastrichtian) chalk and Pleistocene glacial deposits were formed in the Pomeranian W2 phase of the late Weichselian (see Kenzler and Hüneke, 2019). The detailed stratigraphy of the Maastrichtian chalk outlined by the flint-band numbers has been adapted from Steinich (1972). The Pleistocene sediments lie paraconformably on the chalk, parallel to this major lithostratigraphical boundary. The older glacial sediments (older than Pomeranian W2 phase) are subdivided into the tills/diamictons M1 and M2 that are separated and overlain by the units I1 and partly I2 with interbedded gravel, sand, and clay (e.g. Steinich, 1972; Panzig, 1995; Müller and Obst, 2006; Kenzler et al., 2015, 2016). These glacial deposits are cut by thrust faults at the trailing end of each imbricate in the SSW, below the large hanging-wall anticlines of the southerly adjoining thrust sheets. The youngest M3 sediment complex (Pomeranian W2 phase/Mecklenburg W3 phase) lies unconformably upon a major erosion surface, which truncates the underlying glacitectonised sequence (chalk, M1, I1, M2, I2) (e.g. Steinich, 1972; Panzig, 1995; Müller and Obst, 2006; Niedermeyer et al., 2010). At the top of the Kieler Ufer cliff the M3 complex is only exposed in small patches. The tectonic setting at the Kieler Ufer shows an imbricate fan with six major thrust sheets subjected to fault-bend folding (Fig. 1b). The six thrust sheets S11 to S16 strike SSW–NNE and are exposed by the N–S-trending sea cliff at high angle.
Cross-section restoration and balancing is an increasingly applied kinematic-analysis technique in glacial environments. This was well demonstrated for instance by Croot (1987), Pedersen (2005), and Benediktsson et al. (2010). The restoration of the Kieler Ufer section has been performed on the single imbricates of the cliff profile in several experiments using different algorithms and bedding geometries until the best-fit interpretation could be used for shortening calculations and further interpretation (software: Move and the supplementary module 2-D Kinematic Modelling). The tectonic model, which best explains the geometry of the six thrust sheets at the Kieler Ufer is shown in Fig. 1. Regarding the structural evolution of classic fold-and-thrust belts, the restoration worked backwards from the distal to the proximal deformation area (see Pedersen, 2005). Thus, the youngest sheet S16 (closest to the foreland of the southern structural sub-complex) was first restored, and the oldest sheet S11 (closest to the hinterland) was restored in the end. Within the scope of the restoration, the individual thrust sheets (S11 to S16) have been renamed (KU1, KU2, KU3d1, KU3d2, KU3d3, KU4) according to the chronology of re-deformation (see Figs. 1 and 5). The orientation values of beds and faults were adapted from the best-fit model of the Kieler Ufer section, and they have been compared with those given by Steinich (1972).
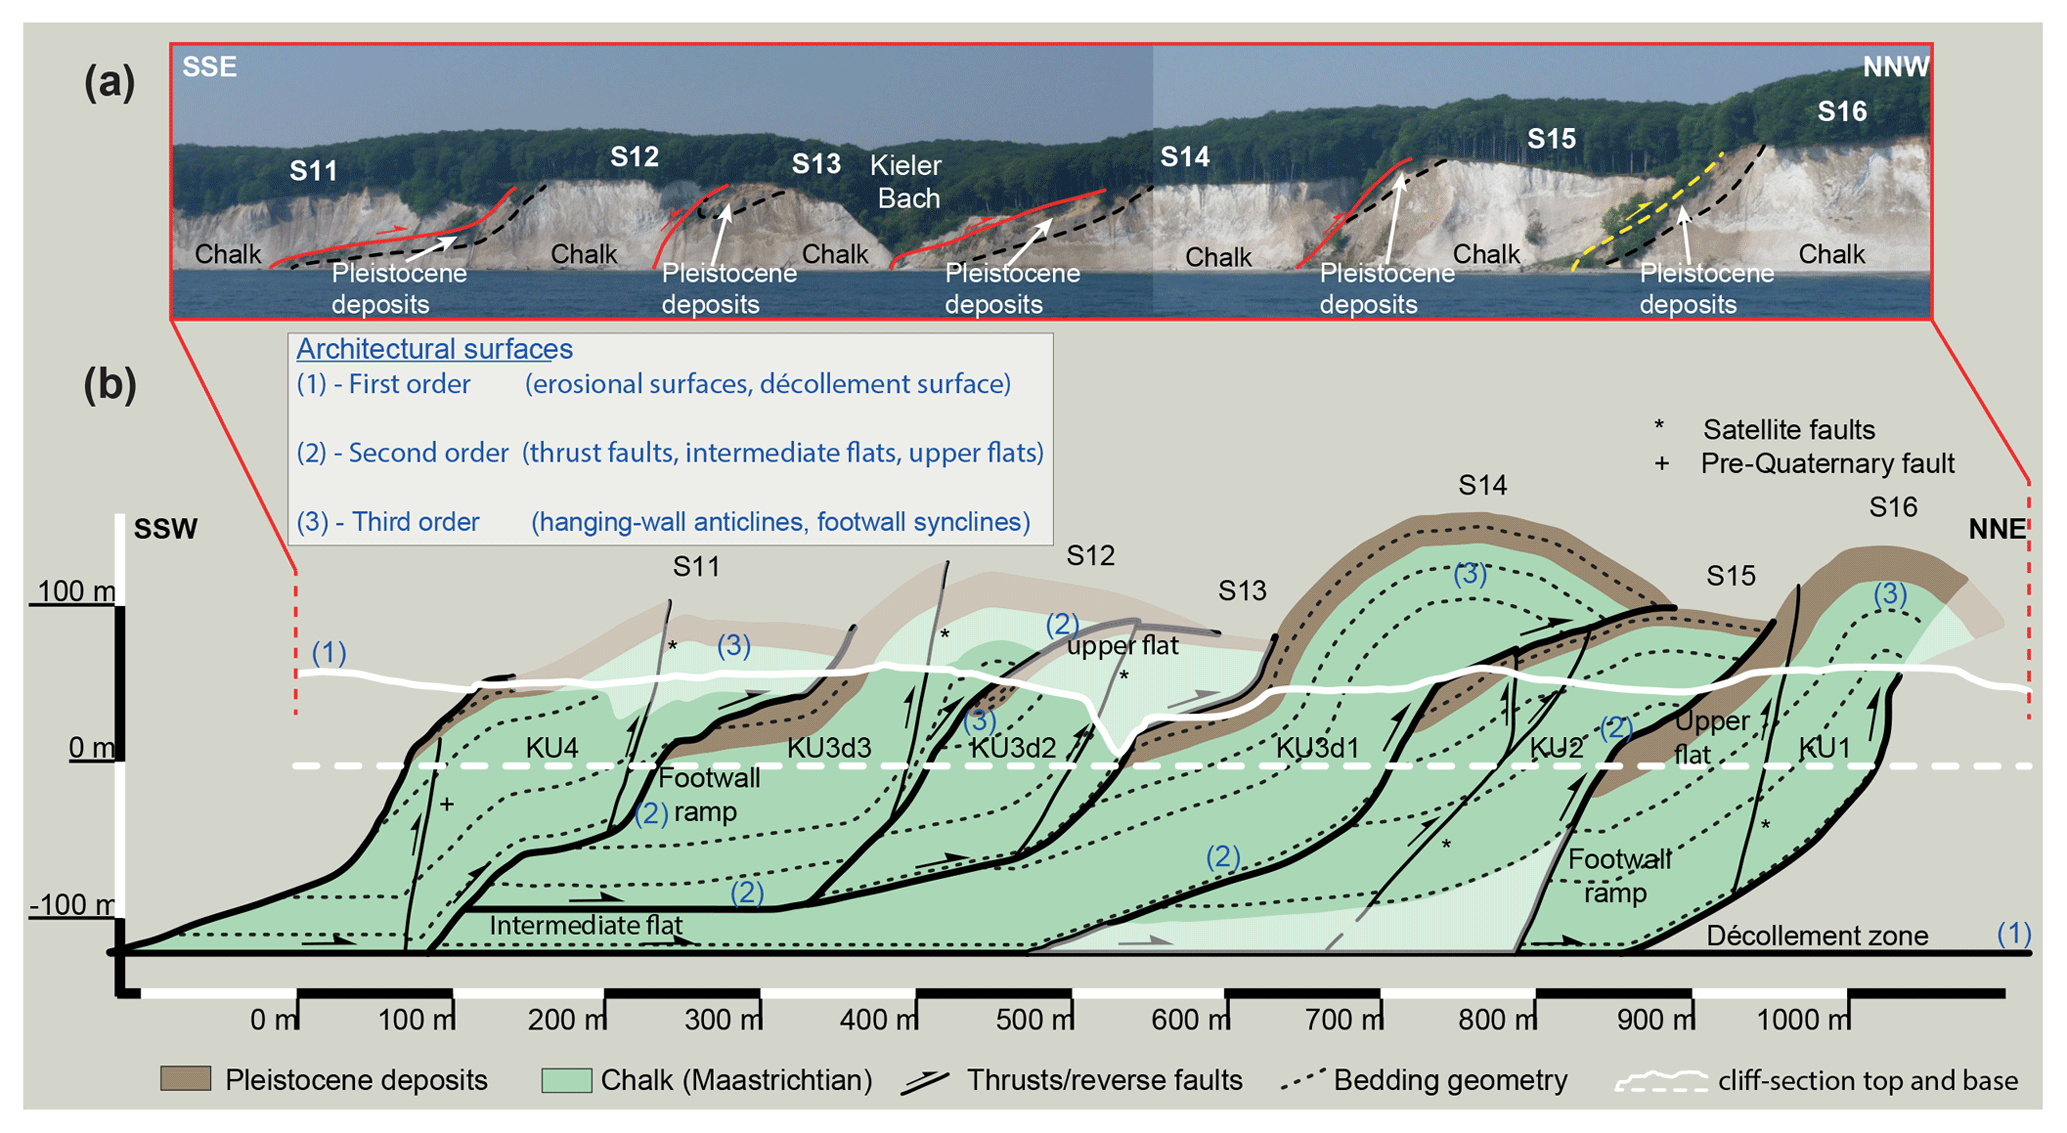
Figure 1Structural conditions of the Kieler Ufer section (S11 to S16). (a) Overview of the thrust sheets S11 to S16 at the cliff coast. The red/yellow lines indicate thrust faults. The black dashed lines show the sedimentary boundary between Cretaceous chalk and Pleistocene glacigenic deposits. (b) Projected and interpreted cross section (simplified). Architectural surfaces are marked by numbers 1 to 3. Transparent fields represent approximate interpretations.
There are generally three individual thrust sheets: S16, S15, and S11 (KU1, KU2, and KU4). A duplex stack consisting of S14, S13, and S12 (KU3d1, KU3d2, and KU3d3) and the lowermost part of the thrust sheet S15 (KU2) are subject to debate. The highest point of the interpreted cross section is the hanging-wall anticline of S14 (166 m a.s.l.). Three different architectural surfaces occur between S11 and S16 (sensu stricto Pedersen, 2014) (Fig. 1b). The top of the cliff and minor zones, where the base-M3 unconformity occurs (mainly S12 and S16), are first-order surfaces. Another first-order surface is the décollement zone at ca. 120 m b.s.l. The ramps and upper flats between the sections are second-order surfaces. Considering the duplex stack, the intermediate flat at ca. 92 m b.s.l. (KU3d3) also belongs to the second-order surfaces. The bedding outlining the hanging-wall anticlines and the footwall syncline in S13 belong to the third order.
The Kieler Ufer section contains at least five satellite faults, which may have formed during the glacitectonic thrusting (Fig. 1b). Their age (post-, pre-, syn-tectonic) is difficult to determine, as they are truncated by the erosional unconformity at the cliff top. However, the interpretation can be related to the best-fit model using Move and the supplementary module 2-D Kinematic Modelling as well as comparisons with the faults in the surrounding sections. The reverse satellite fault in S16 dips steeply towards the SW, 235/70 (dip direction/dip), and shows an offset of at least 6 m. The satellite fault in S15 (presumably 250/47, 250/56) forms a vertical splay at a branch point about 7 m a.s.l. The offset at the main fault is about 10 m in the lowermost part. Above the branch point, the offset is less strong with ca. 3 to 4 m at each fault. The satellite fault in S13 may be moderately to steeply inclined towards the S (190/61), which is similar to that in S12. The northerly reverse fault in thrust sheet S11 is also assumed to have formed during glacitectonism of the southern structural sub-complex. It dips towards the SW by 72∘. The southern reverse fault (205/80), on contrary, can certainly be interpreted as a pre-Quaternary structure, since it does not displace the chalk top and the Pleistocene beds above (Fig. 1b).
2.1 The youngest thrust sheets S16 (KU1) and S15 (KU2)
The footwall-ramp panel of the thrust sheet S16 contains flint bands and Pleistocene beds, which are gently inclined to the SSW (Fig. 2a). The beds steepen towards the centre of the tight hanging-wall anticline in the northern part. The Pleistocene deposits reach the cliff bottom, since their trend corresponds to the geometry of the moderately inclined footwall ramp below S16 and they are cut by the S15/S16 thrust fault only at or even closely below the cliff bottom (Figs. 1 and 2a). The frontal thrust fault of the Kieler Ufer section below S16 starts at the décollement at 120 m b.s.l. with a gentle-to-moderate inclination (210/38), and it becomes nearly vertical to the top of the cliff (210/79 and 210/80 following Steinich, 1972). The thrust plane is interpreted to have a slight listric shape.
The thrust sheet S15 is characterised by an open folded geometry both in the footwall-ramp panel and in the hanging-wall anticline (Figs. 1 and 2b). The beds of the southern anticline limb dip towards the SSW by 30∘ on average (210/30). Thus, they are more gently inclined than the beds in S16 (205/45). However, the thrust fault between S14 and S15 is much steeper between 0 and 51 m a.s.l. than the frontal thrust below S16, and therefore it truncates the Pleistocene beds at a higher level than in S16 (Fig. 2). Thus, the Pleistocene unit does not reach the beach level. The thrust fault between S15 and S16 is steeply inclined to the SSW (205/65), and at a hinge point ca. 15 m above the cliff base it turns into a moderately inclined thrust fault (205/38). In fact, this part represents an upper flat, since it is parallel to the bedding in the S16 thrust sheet below. The inclinations from the best-fit model correspond well to the orientation 205/35 given by Steinich (1972).

Figure 2Detailed 2-D cross sections of the two youngest thrust sheets. (a) S16 with a horizontal length of 175 m at the cliff base but 294 m from its SSW to its NNE end. The thickness of the Cretaceous unit (flint bands F01 to F54) is 98 to 89 m, while the Pleistocene unit (M1, I1, and M2) is 24 m thick. (b) S15 with a horizontal length of 138 m at the cliff base and a total length of 427 m (max 477 m). The maximum thickness of the beds down to F01 is 128 m. The Pleistocene unit (M1 and I1) is ca. 21 to 12 m, while the chalk unit (F01 to F54) is at least 107 m. The coloured lines represent the flint bands of the chalk as well as horizons of the Pleistocene beds; the red lines are faults. The cross sections constructed by Steinich (1972) are shown in the background of each model.
2.2 Duplex stack S14–S13–S12 (KU3d1, KU3d2, KU3d3)
S14 is a long sheet with an open hanging-wall anticline (Figs. 1 and 3a). It is the lowermost element of the central duplex stack in the Kieler Ufer section and shows an S-type duplex segment (see inset in Fig. 3a). The flint bands gently dip towards the SSW (220/19), but the inclination increases towards the anticline core in the SSW (220/60). The thrust faults bounding S14 in the SSW and NNE are relatively steep in the cliff section, but they are more gently inclined below the cliff bottom, regarding the best-fit model. The frontal ramp starts at the décollement with an initially gentle inclination towards the SSW (210/21). At the hinge point at 37 m b.s.l. the inclination steepens (210/61). At another hinge point 53 m a.s.l., the thrust fault again turns into a gently inclined fault (210/24).
S13 is the very small central element of the duplex stack (Fig. 3b). It is also an S-type element. The bedding shows a gentle-to-moderate inclination (Fig. 3b). The upper flint bands of the chalk unit and the Pleistocene beds were dragged along the footwall ramp of S12 so that they form a slight footwall syncline in the trailing edge. The base of the thrust sheet is not the décollement or another flat. It is a gently inclined footwall ramp (220/12), which grows steeper at ca. 53 m b.s.l. (220/53). At 21 m a.s.l. the ramp may pass into the upper flat.
S12 is the upper segment of the duplex stack, also indicating an S-type element (Fig. 3c). The bedding of S12 shows a gentle inclination (225/07) until it exhibits a kink-like geometry at about section metre 360 (Fig. 3c). Northeast of this area the inclination is 225/53. Northeast of the satellite fault, the flint bands of the hanging-wall anticline show a succession of two smaller anticlines and a syncline in between, which may point to a thrust-fault geometry exhibiting a double ramp between section metre 445 and 500 rather than the simplified fault shown in Fig. 3c. S12 does not reach the décollement surface at 120 m b.s.l., but it reaches the intermediate flat at ca. 92 m b.s.l. At section metre 323 it turns into the actual footwall ramp of S13, which is gently inclined towards the SSW. The footwall ramp of S12 starts at section metre 349. It has a moderate inclination towards the S (190/45).
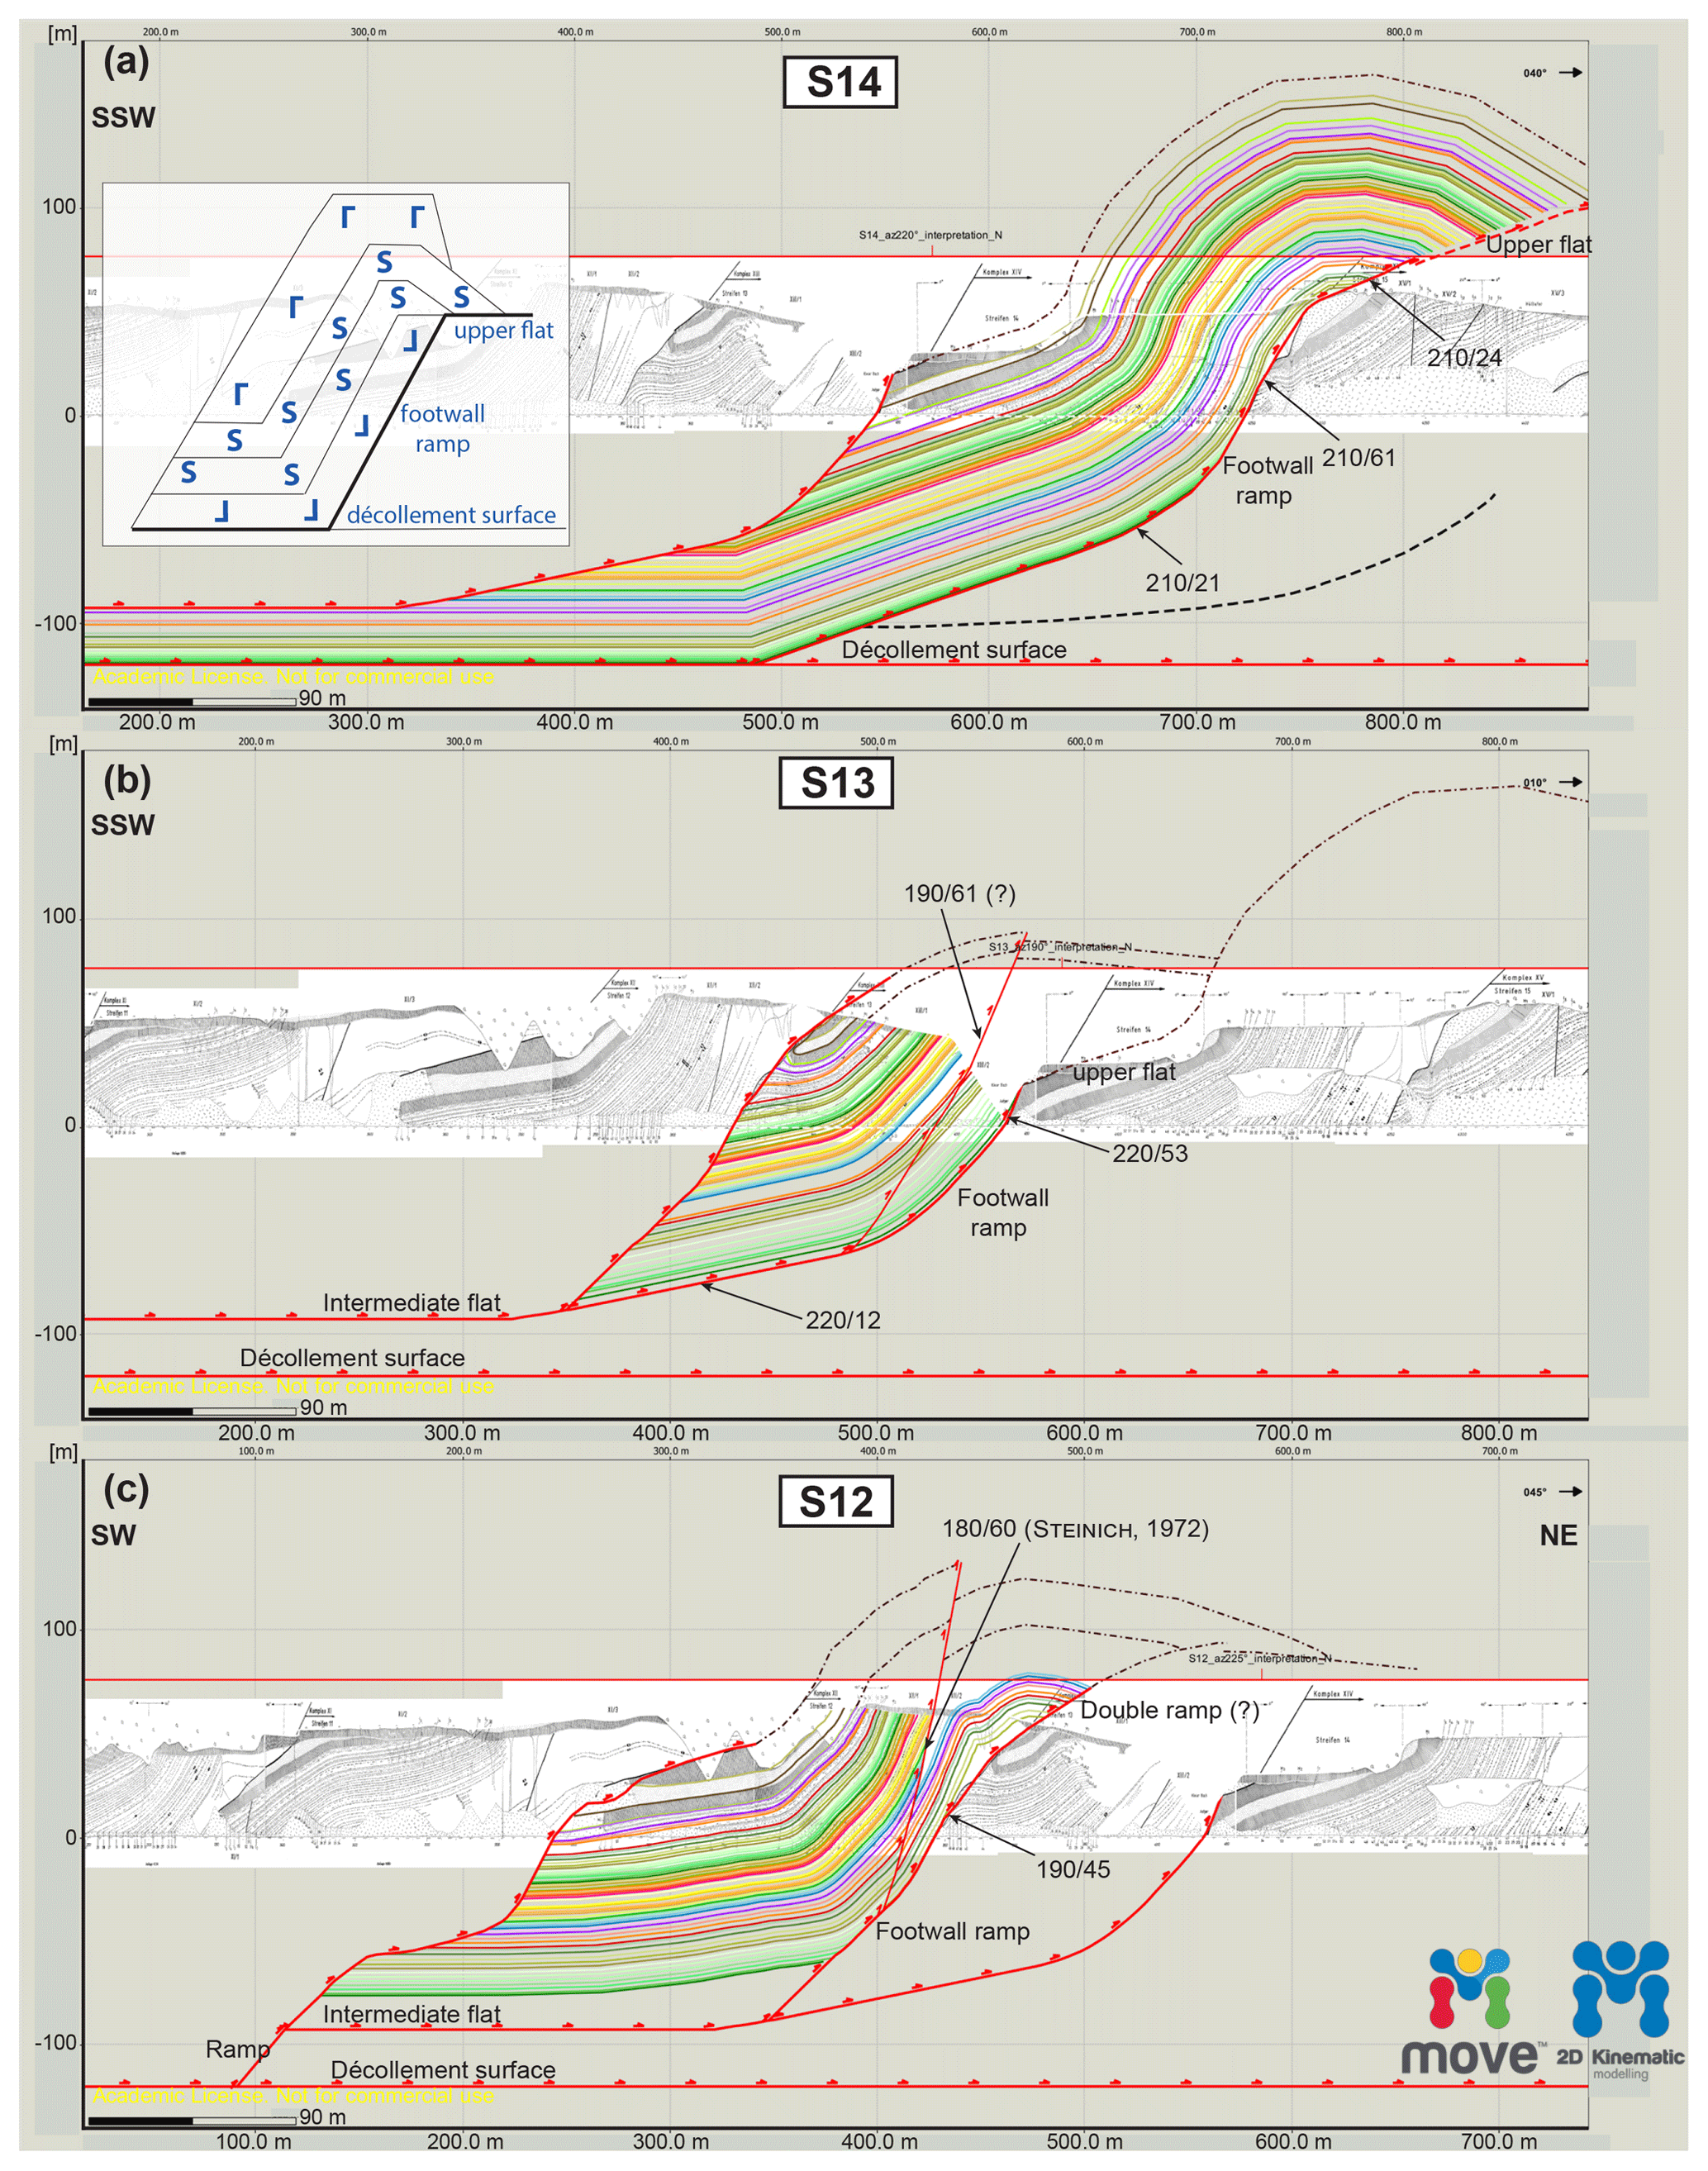
Figure 3Detailed 2-D cross sections of the three duplex-stack elements. The schematic illustration of a duplex stack including the three different elements (L-, S-, and G-type) is given in (a) (modified following Pedersen, 2005). (a) S14 with a horizontal length of 178 m at the beach level but an entire horizontal length from the SSW end to the NNE end of ca. 820 m. The Cretaceous beds (F01 to F54) are 89 m thick at maximum. The thickness of the Pleistocene unit (M1, I1, and M2) is 22 m. (b) S13; the horizontal length is 131 m at the cliff base but 315 m from its SSW end to its NNE end. The chalk unit (F01 to F54) has a maximum thickness of 94 m. The Pleistocene deposits (M1, I1, and M2) are up to 14 m. (c) S12 with a horizontal length of 184 m at the cliff base. The entire horizontal length is 506 m. The entire bed thickness in the thrust sheet is 106 m from the F01 flint band to the topmost bed in the Pleistocene sequence. However, the bed thickness from the thrust-sheet base to the top is 131 m. The Cretaceous unit has a thickness of 81 m (F01 to F54/chalk top) but a of maximum 106 m. The Pleistocene sequence is ca. 25 m. The coloured lines represent the flint bands of the chalk as well as horizons of the Pleistocene beds; the red lines are faults. A detailed legend for the horizons and faults can be found in Fig. 2. The cross sections constructed by Steinich (1972) are shown in the background of each model.
2.3 The oldest thrust sheet S11 (KU4)
The southernmost and oldest thrust sheet of the Kieler Ufer section is S11, which is an individual thrust sheet SSW of the duplex stack (Fig. 1). Due to the step-like geometry of the thrust fault between S11 and S12, the bedding also shows a kinking geometry (Fig. 4). In the SSW of S11, the beds are moderately inclined to the SSW (205/45), while the central beds are gently inclined (205/18). Farther north, the inclination gets steeper again to form the southern limb of the hanging-wall anticline. The hanging-wall anticline is characterised by two smaller anticlines comparable to the frontal edge of S12. This is a hint to a double-ramp configuration of the frontal thrust fault (Fig. 4). Below this structure, the ramp steeply dips to the SW (225/61). At a hinge point 57 m b.s.l. the ramp is only gently inclined (225/13). In its lowermost part, it forms the moderately inclined ramp between the décollement surface and the intermediate flat, on which S12 and S13 were translated.
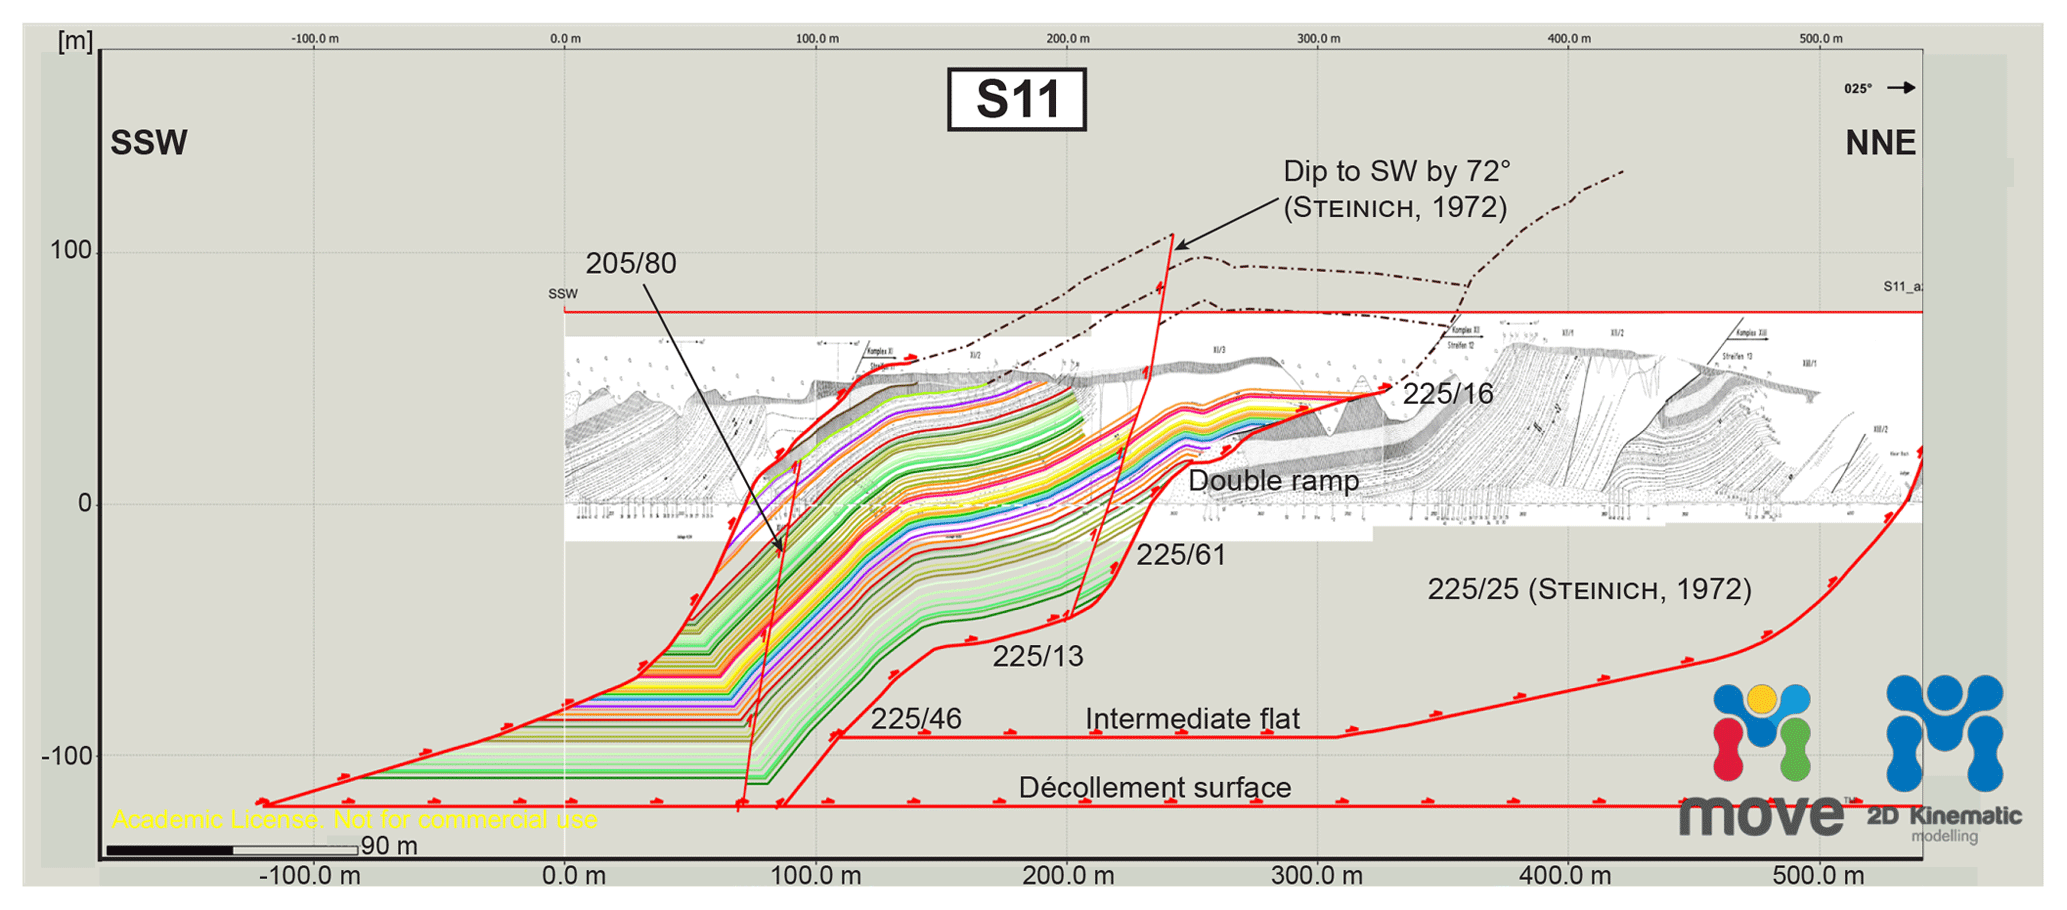
Figure 4Detailed 2-D cross section of the oldest thrust sheet S11 in the Kieler Ufer section. The horizontal length is about 162 m. The entire thrust sheet has a horizontal length of 478 m from the southernmost to the northernmost end. The chalk deposits (F01 to F54) are about 100 m thick; the Pleistocene unit (M1 and I1) is at least 16 m. The coloured lines represent the flint bands of the chalk as well as horizons of the Pleistocene beds; the red lines are faults. A detailed legend for the horizons and faults can be found in Fig. 2. The cross sections constructed by Steinich (1972) are shown in the background of each model.
The kinematic analysis of the Kieler Ufer section led to strain quantification and the illustration of stress orientation. It includes strain partitioning and, hence, the separation of the shortening amount into folding and faulting. Cross-section restoration and balancing of the imbricate fans of the southern structural sub-complex revealed that the Kieler Ufer section had an initial length of at least 2482 m before its glacitectonic imbrication. Thus, the entire horizontal shortening of the Kieler Ufer section is 1280 m (51.6 %) at its minimum. This includes both folding and the translation along the flats and ramps. The process of folding constitutes only 20.5 % (263 m) of the entire deformation, while the translation part is even 79.5 % (1017 m). The amount of displacement along the individual thrust faults is 206 m (KU1), 164 m (KU2), 328 m (KU3d1), 521 m (KU3d2), 438 m (KU3d3), and 243 m (KU4). The stress was directed from the SSW to NNE. The orientation fits well into the glacio-dynamic model suggested by Gehrmann and Harding (2018). The glacier with a piedmont-type lobe mainly moved from the SE to NW in the second evolutionary stage and induced local stress in all sides due to the radial propagation in the unconfined ice-marginal zone (see e.g. Ó Cofaigh et al., 2003; Jónsson et al., 2014). This induced a local orientation change of the thrust faults from a dip to the SE in the inland zone of the southern sub-complex to the S/SW at the eastern cliff.
The final cross section of the Kieler Ufer section cannot be completely balanced. There are smaller restoration gaps in the northern parts of the restored sheets KU1, KU2, and KU3d1 (S16, S15, S14) (Fig. 5). A large gap can be seen in the northern end of KU3d2 (S13). Projection of the cliff sections has been considered in the modelling process to reduce such errors. The azimuth of the final large track of the Kieler Ufer section is 210∘, adapted from the main orientation of the thrust faults or individually of the flint bands. The projection has been performed normal to the sections. However, the gaps represent volume loss during deformation rather than construction errors. Tectonic erosion may have occurred at the ramps, when the single sheets were thrust up, leading to small gaps in the frontal edge of the thrust sheets in the restored cross section. In addition, it has to be taken into account that the restored cross section only shows a 2-D interpretation. In particular, the large restoration gap in KU3d2 (S13) may point to a very complicated bedding and deformation history in the area of the Kieler Ufer section, which is highly likely related to interference between the northern and southern structural sub-complex. The specific complexity is confirmed by the high amount of shortening (51.6 %) and the duplex stack in the centre of the Kieler Ufer section.
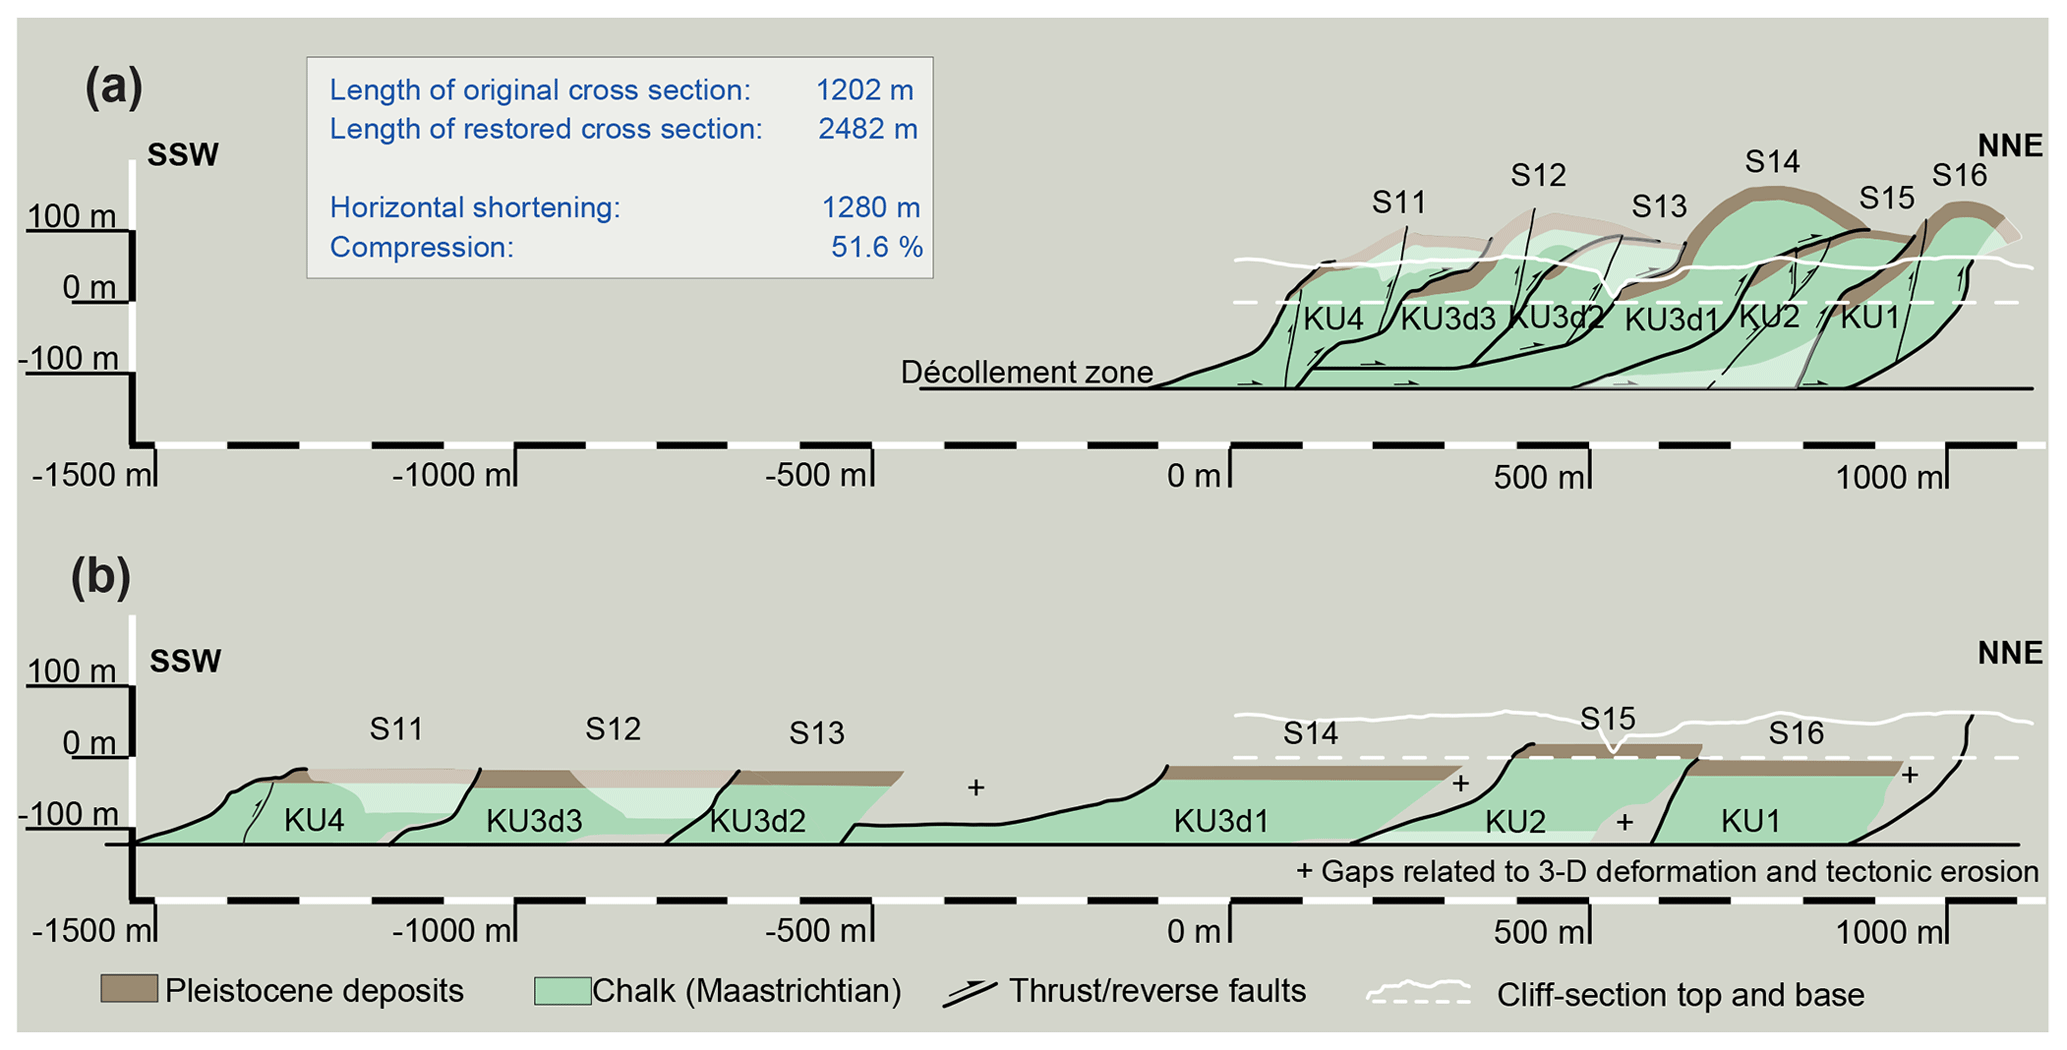
Figure 5Interpretation and restoration of the Kieler Ufer section (S11 to S16) with horizontal-shortening results. (a) Cross section interpreted above and below the cliff boundaries (simplified). (b) Restored cross section indicating the configuration before the glacitectonic deformation of the southern structural sub-complex. The restored thrust sheets are additionally labelled with the new abbreviations KU1 to KU4, which represent the chronology of the restoration process.
The Kieler Ufer section represents a structural key location in the thrust-dominated-to-fold–thrust-dominated glacitectonic complex of Jasmund (see Boulton et al., 1999). The specific geometric features of the constructed and restored cross section led to major information on the kinematics and deformation history, including the relationship between the northern and southern structural sub-complex of Jasmund.
The southern sub-complex exhibits a realistic décollement depth at mainly 120 m b.s.l., because the deformation in ancient glacitectonic complexes can extend to a depth of a few tens of metres up to 200 m (e.g. Aber et al., 1989; van der Wateren, 2003; Huuse and Lykke-Andersen, 2000; Vaughan-Hirsch and Phillips, 2017). Modern structurally similar glacitectonic landforms are generally smaller, with décollement depths of about 5 to 30 m (e.g. Boulton et al., 1999; Benediktsson et al., 2010).
Considering the classic separation of glacitectonic complexes into a proximal, central, and distal zone (e.g. Boulton et al., 1999; Pedersen, 2000), the Kieler Ufer section is part of the central zone, which is characterised by a highly complicated structural framework of duplex stacks and steeply dipping thrust faults implying a high-strain area with intensive thrusting and shortening. The Kieler Ufer section has the highest amount of horizontal shortening (51.6 %) compared to the other sections of the southern sub-complex. The highest elevations of the modelled southern structural sub-complex are at the hanging-wall anticlines of the central zone (e.g. S14: 166 m a.s.l.), which may confirm the intensive deformation and compression. Boulton et al. (1999) also described the more intensive folding and thrusting for the centre of the modern glacitectonic complex in front of Holmstrømbreen on Svalbard.
There are also substantial differences between Jasmund and previously described glacitectonic complexes when the entire southern sub-complex is considered. While most glacitectonic complexes indicate a significant strain decrease from the proximal to the distal end, the Jasmund Glacitectonic Complex is characterised by a constantly high strain. Normally, the length of the thrust sheets increases towards the foreland, which implies a greater degree of shortening towards the proposed ice margin (e.g. Pedersen, 2005; Vaughan-Hirsch and Phillips, 2017). However, such a trend cannot be seen in the southern sub-complex of Jasmund. Typically, the angle of the thrust faults and the offsets decrease towards the foreland (Dixon and Liu, 1992; Pedersen, 2005; Vaughan-Hirsch and Phillips, 2017). This is also not the case in the Jasmund Glacitectonic Complex. Even though the steepest thrust sheets are situated in the most proximal zone, there are still steeply to moderately inclined faults in the central and distal zone. This phenomenon can be explained with the complex relationship between the northern and southern structural sub-complex of Jasmund. Since the northern sub-complex was formed first by an earlier glacitectonically effective glacier in the SW Baltic Sea region, there already existed the structural framework of a glacitectonic complex in the north of the southern structural sub-complex. Thus, an obstacle in front of the deformation area has controlled the imbrication during the second stage (see Gehrmann and Harding, 2018). These circumstances intensively affected the deformation process of the southern sub-complex as well as its internal structure. There was no possibility to form gently inclined thrust faults in the distal foreland during the final deformation, as the northern sub-complex acted as a resistance. The stress induced by both the glacier and the northern sub-complex led to the documented highly complex architecture, which represents an exception from classic glacitectonic-complex models (unconfined). The structural configuration of Jasmund can be used as a model characteristic of confined glacitectonic complexes. It is all the more so an example of various and intensive superimpositions in a multi-stage structural evolution (see Pedersen, 2000).
The data are publicly available via the thesis Gehrmann (2018) and the references therein online at https://nbn-resolving.org/urn:nbn:de:gbv:9-opus-24751 (last access: 22 July 2019).
AG designed the methodology, performed the analysis, and prepared the manuscript with contributions from all co-authors.
The authors declare that they have no conflict of interest.
We acknowledge granting of software licences (Move™ suite) from Midland Valley Exploration Ltd for the years 2014 to 2018. Ralf-Otto Niedermeyer is thanked for his constructive review. We acknowledge support for the article processing charge from the DFG (no. 393148499) and the Open Access Publication Fund of the University of Greifswald.
This research has been supported by the DFG (German Research Foundation, grant no. 393148499) and the Open Access Publication Fund of the University of Greifswald.
Aber, J. S., Croot, D. G., and Fenton, M. M.: Glaciotectonic Landforms and Structures, Kluwer, Dordrecht, 1989.
Benediktsson, Í. Ö., Schomacker, A., Lokrantz, H., and Ingólfsson, Ó.: The 1890 surge end moraine at Eyjabakkajökull, Iceland: a re-assessment of a classic glaciotectonic locality, Quaternary Sci. Rev., 29, 484–506, https://doi.org/10.1016/j.quascirev.2009.10.004, 2010.
Boulton, G. S., van der Meer, J. J. M., Beets, D. J., Hart, J. K., and Ruegg, G. H. J.: The sedimentary and structural evolution of a recent push moraine complex: Holmstrømbreen, Spitsbergen, Quaternary Sci. Rev., 18, 339–371, 1999.
Croot, D. G.: Glacio-tectonic structures: a mesoscale model of thin-skinned thrust sheets?, J. Struct. Geol., 9, 797–808, 1987.
Dixon, J. M. and Liu, S.: Centrifuge modelling of the propagation of thrust faults, in: Thrust Tectonics, edited by: McClay, K. R., Chapman & Hall, London, 53–70, 1992.
Gehrmann, A.: The multi-stage structural development of the Upper Weichselian Jasmund Glacitectonic Complex Rügen, NE Germany), Dissertation, Faculty of Mathematics and Natural Sciences, University of Greifswald, Germany, 2018.
Gehrmann, A. and Harding, C.: Geomorphological Mapping and Spatial Analyses of an Upper Weichselian Glacitectonic Complex based on LiDAR Data, Jasmund Peninsula (NE Rügen), Germany, Geosciences, 8, 208, https://doi.org/10.3390/geosciences8060208, 2018.
Gehrmann, A. and Harding, C.: Blieschow on Jasmund – Geomorphology and glacigenic landforms: keys to understanding the deformation chronology of Jasmund, DEUQUA Spec. Pub., this volume, 2019.
Huuse, M. and Lykke-Andersen, H.: Large-scale glaciotectonic thrust structures in the eastern Danish North Sea, in: Deformation of Glacial Materials, edited by: Maltman, A. J., Hubbard, B., and Hambrey, M. J., Geol. Soc. London Spec. Pub., 176, 293–305, https://doi.org/10.1144/GSL.SP.2000.176, 2000.
Jaekel, O.: Neue Beiträge zur Tektonik des Rügener Steilufers, Zeitschrift der Deutschen Geologischen Gesellschaft, 69, 81–176, 1917.
Jónsson, S. A., Schomacker, A., Benediktsson, Í. Ö., Ingólfsson, Ó., and Johnson, M.: The drumlin field and the geomorphology of the Múlajökull surge-type glacier, central Iceland, Geomorphology, 207, 213–220, https://doi.org/10.1016/j.geomorph.2013.11.007, 2014.
Kenzler, M. and Hüneke, H.: Sea cliff at Glowe: Stratigraphy and absolute age chronology of the Jasmund Pleistocene sedimentary record, DEUQUA Spec. Pub., this volume, 2019.
Kenzler, M , Tsukamoto, S., Meng, S., Thiel, C., Frechen, M., and Hüneke, H.: Luminescence dating of Weichselian interstadial sediments from the German Baltic Sea coast, Quat. Geochronol., 30, 251–256, https://doi.org/10.1016/j.quageo.2015.05.015, 2015.
Kenzler, M., Tsukamoto, S., Meng, S., Frechen, M., and Hüneke, H.: New age constraints from the SW Baltic Sea area – implications for Scandinavian Ice Sheet dynamics and palaeo-environmental conditions during MIS 3 and early MIS 2, Boreas, 46, 34–52, https://doi.org/10.1111/bor.12206, 2016.
Müller, U. and Obst, K: Lithostratigraphie und Lagerungsverhältnisse der pleistozänen Schichten im Gebiet von Lohme (Jasmund/Rügen), Zeitschrift für geologische Wissenschaften, 34, 39–54, 2006.
Niedermeyer, R.-O., Kanter, L., Kenzler, M., Panzig, W.-A., Krienke, K., Ludwig, A. O., Schnick, H. H., and Schütze, K.: Die Insel Rügen (I) – Fazies, Stratigraphie, Lagerungsverhältnisse und geologisches Gefahrenpotenzial pleistozäner Sedimente der Steilküste Jasmund, in: Eiszeitlandschaften in Mecklenburg-Vorpommern, Exkursionsführer zur 35. Hauptversammlung der Deutschen Quartärvereinigung DEUQUA e.V. und der 12. Jahrestagung der INQUA PeriBaltic Working Group in Greifswald/Mecklenburg-Vorpommern, edited by: Lampe, R. and Lorenz, S., Geozon, Greifswald, 50–71, https://doi.org/10.3285/g0005, 2010.
Ó Cofaigh, C., Evans, D. J. A., and England, J.: Ice-marginal terrestrial landsystems: sub-polar glacier margins of the Canadian and Greenland high arctic, in: Glacial Landsystems, edited by: Evans, D. J. A., Arnold, London, 44–64, 2003.
Panzig, W.-A.: Zum Pleistozän Nordost-Rügens, in: Geologie des südlichen Ostseeraumes – Umwelt und Untergrund, edited by: Katzung, G., Hüneke, H., and Obst, K., Terra Nostra, Schriften der Alfred-Wegener-Stiftung, 6, 177–200, 1995.
Pedersen, S. A. S.: Superimposed deformation in glaciotectonics, B. Geol. Soc. DENMARK, 46, 125–144, 2000.
Pedersen, S. A. S.: Structural analysis of the Rubjerg Knude Glaciotectonic Complex, Vendsyssel, northern Denmark, Geol. Surv. Den. Greenl., 8, 1–192, 2005.
Pedersen, S. A. S.: Architecture of Glaciotectonic Complexes, Geosciences, 4, 269–296, https://doi.org/10.3390/geosciences4040269, 2014.
Steinich, G.: Endogene Tektonik in den Unter-Maastricht-Vorkommen auf Jasmund (Rügen), Geologie, 20, Supplement 71/72, 1–207, 1972.
van der Wateren, F. M.: Ice-marginal terrestrial landsystems: southern Scandinavian ice sheet margin, in: Glacial Landsystems, edited by Evans, D. J. A., Arnold, London, 166–203, 2003.
Vaughan-Hirsch, D. P. and Phillips, E. R.: Mid-Pleistocene thin-skinned glaciotectonic thrusting of the Aberdeen Ground Formation, Central Graben region, central North Sea, J. Quaternary Sci., 32, 196–212, https://doi.org/10.1002/jqs.2836, 2017.
- How to cite
- Abstract
- Introduction
- The Kieler Ufer section as representative part of Jasmund's southern structural sub-complex
- The restored cross section: key to understanding Jasmund's glacitectonic evolution and kinematics
- The southern sub-complex of Jasmund in the context of glacitectonic-complex models
- Data availability
- Author contributions
- Competing interests
- Acknowledgements
- Financial support
- References